farm bill
Image Credit: Table.Media Every week we track the business, tech and investment trends in CPG, retail, restaurants, agriculture, cooking and health, so you don’t have to. Here are [...]
Image Credit: Green Queen Every week we track the business, tech and investment trends in CPG, retail, restaurants, agriculture, cooking and health, so you don’t have to. Here are [...]
Source: Blue Apron Every week we track the business, tech and investment trends in CPG, retail, restaurants, agriculture, cooking and health, so you don’t have to. Here are some of[...]
Source: The Verge Every week we track the business, tech and investment trends in CPG, retail, restaurants, agriculture, cooking and health, so you don’t have to. Here are some of [...]
Source: Kroger Every week we track the business, tech and investment trends in CPG, retail, restaurants, agriculture, cooking and health, so you don’t have to. Here are some of thi[...]
Image source: Livemint Every week we track the business, tech and investment trends in CPG, retail, restaurants, agriculture, cooking and health, so you don’t have to. Here are som[...]
Source: Go Dairy Free Every week we track the business, tech and investment trends in CPG, retail, restaurants, agriculture, cooking and health, so you don’t have to. Here are some[...]
Image source: Tate’s Bake Shop Every week we track the business, tech and investment trends in CPG, retail, restaurants, agriculture, cooking and health, so you don’t have to[...]
Every week we track the business, tech and investment trends in CPG, retail, restaurants, agriculture, cooking and health, so you don’t have to. Here are some of this week’s top he[...]
Guest post by Matte Rothe, co-founder, FEED Collaborative. The views expressed here are solely those of the author and do not reflect the views of Food+Tech Connect. While many of[...]
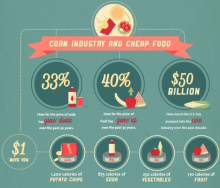
Americans may be spending less money on food, but dollars saved are just being spent on the resulting costs of poor health that plague the nation.
[...]
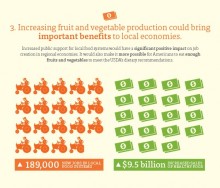
USDA dietary guidelines recommend that 50 percent of our daily food intake should be fruits and vegetables. But there is clearly a disconnect between the guidelines and the mere 2[...]
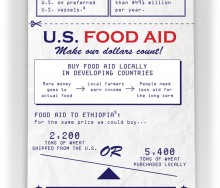
What is the human impact of inefficiencies in how your tax dollars are spent? In 2010 the U.S. spent $2 billion total on international food aid, but $491 million of those ta[...]
Looking for programs in the farm bill related to public health, international development or commodity support? The Visualizer is an invaluable tool that allows viewers to interac[...]
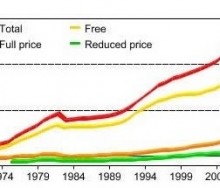
On the Friday before Christmas, Food+Tech Connect brings you a graphic from the USDA's Economic Reporting Service to help put things into perspective.[...]
Ten sponsors and 120 people came out for the Farm Bill Hackathon on their day off, to work twelve hours straight. But the question is: why? [...]
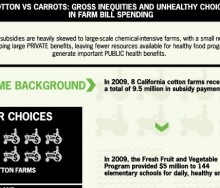
This week's graphic compares the money given in subsidies to eight cotton farms in California to that spent on the Fresh Fruit and Vegetable Program supplying snacks to elementary [...]
Monday, Food+Tech Connect announced the winners of the Farm Bill Hackathon, but several other interesting projects were also created.[...]
Food+Tech Connect has created a simple time line (with lots of links) below to illustrate the State of the Farm Bill, and to explain that, in the end, the outcome of all this Congr[...]
On December 3, Food+Tech Connect and Gojee are bringing together journalists, technologists, designers, policy makers, and food data specialists to develop tools and visualizations[...]
Thus far, there is little in the way of visually interesting and informative media about the Farm Bill. But here are Food+Tech Connect's picks for the first 6 Farm Bill Media Sensa[...]
Yesterday, Food+Tech Connect announced we will be holding a “Farm Bill Hackathon” on December 3rd. But what is the “Farm Bill?”[...]
Mark your calendar! On December 3, Food+Tech Connect & Gojee are bringing together journalists, technologists, designers, policy makers, and food data specialists to develop tools [...]
Media artist and Eyebeam Resident Stefani Bardin is outraged by the way that nutritional information is currently obscured and delivered, which causes detrimental effects to our he[...]
What a year for food and tech! It has been truly wonderful getting to know all of you over the past couple of months. I can’t wait to connect with more of you at the events ([...]
12
18 Feb 2025
, 0 Comment
17 Dec 2024
, 0 Comment
Copyright © 2015
Food+Tech Connect. All Rights Reserved. Made in New York.


