Infographics
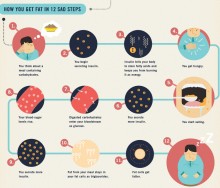
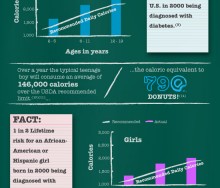
In the United States 35 percent of adults and 17 percent of children are obese. Medical costs related to obesity reached 147 billion in 2008 alone. And obesity-related conditions i[...]
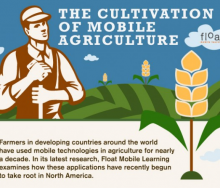
This Infographic details how US farmer mobile adoption for farm and business management is skyrocketing. [...]
A look at Food+Tech Connect's top 5 food and health infographics of 2012.[...]
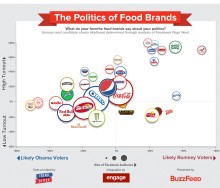
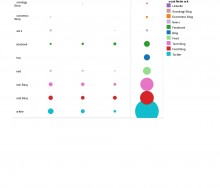
Two infographics look at Facebook data to understand how our daily food choices reflect our politics.[...]
Mark your calendar! On December 3, Food+Tech Connect & Gojee are bringing together journalists, technologists, designers, policy makers, and food data specialists to develop tools [...]
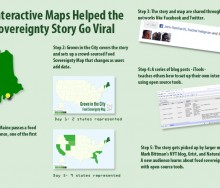
This year we witnessed first hand the power of open source tools to quickly spread the word about food system policy and planning. When Sedgwick, Maine passed the first food sover[...]
[Editors Note: This is the third story in a series about meat distribution. Food + Tech Connect will run these stories every Monday for the next several weeks.] In mid July, the En[...]
In early July I read in The New York Times that the World Bank is releasing 7,000 data sets into the public domain. So I decided to check it out and see what’s there. Not a lot, it[...]
User interface and data visualization design firm FFunction created this infographic to visualize the severe decline of the honey bee population (Colongy Collapse Disorder) over th[...]
Mint.com Mint.com created this interactive infographic visualizing the consumption, production, and production value of the most commonly used burrito ingredients.[...]
“You’re about to die, what’s your last meal?” Since 2007, Studiofeast supper club founder Mike Lee has asked his mailing list subscribers to answer this que[...]
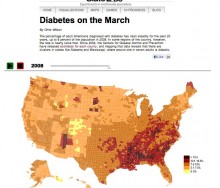
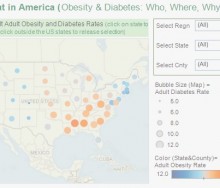
This interactive visualization by SlateLabs demonstrates the rise in diabetes diagnoses among adult Americans. Slate used data from the Centers for Disease Control and Prevention t[...]
Illustration by Melkorka Kjarval Grass-fed beef has become a household name, but despite unprecedented awareness and demand, many American producers find themselves struggling to m[...]
It’s been quite a week for food safety! Tuesday, the senate approved the largest overhaul of food safety legislation in 70 years. If passed, the Food Safety Modernization Act[...]
This Saturday December 5, food enthusiasts of all kinds including hackers, urban farmers, restauranteurs, designers, and public figures, will come together to hack on open food sys[...]
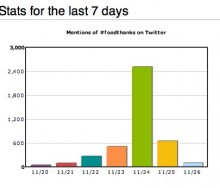
On Tuesday, I posted about the AgChat Foundations #Foodthanks campaign aimed at engaging the public in sharing thanks with those that grow and get our food from farm to table. Curi[...]
Happy Thanksgiving! I hope you all are enjoying a delicious day with friends &/or family. I have so much to be thankful for this year, so I thought I would take a moment to giv[...]
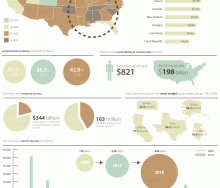
Infographic about the health and fiscal cost school lunches using USDA, Let's Move & Slow Food USA data.[...]
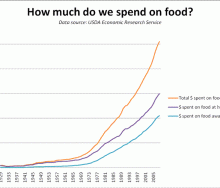
In an article last week, I discussed data that shows that a farmer receives a dwindling portion of the consumer food dollar in the US. The data does not explain the ratio of whole [...]
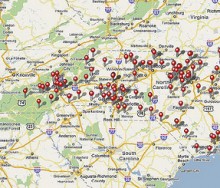
In 2010, the USDA National Farmers Market Directory counted over 6,200 operational farmers markets in the country. That’s more than a 16 percent growth in farmers markets from 2009[...]
Flowing Data founder Nathan Yau has created an interactive infographic that allows you to explore FDA product recall and market withdrawals data. The graphic allows you to easily i[...]
13 Nov 2010
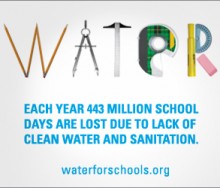
UncategorizedLast week was Blog Action Day, a day where 4,319 Blogs and 33.2 million readers from 131 different countries came together virtually to highlight and read about clean water. In all[...]
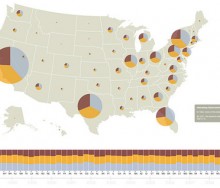
Rina Peterson's "Fit & Fat in America" enable users to examine various factors associated with obesity.[...]
Are you a visual thinker? I am and I dig data. I know for most its not a very exciting topic. In fact, eyes tend to glass over as soon as I utter the “d word.” But, I&#[...]
As a new blogger, I never anticipated that our Visualizing our Food System post would spread so virally. It was incredible to see the response it provoked from people across a ran[...]
12
18 Feb 2025
, 0 Comment
17 Dec 2024
, 0 Comment
Copyright © 2015
Food+Tech Connect. All Rights Reserved. Made in New York.

