| Connect with us



The Platform For GOOD FOOD INNOVATION
27 Dec 2010
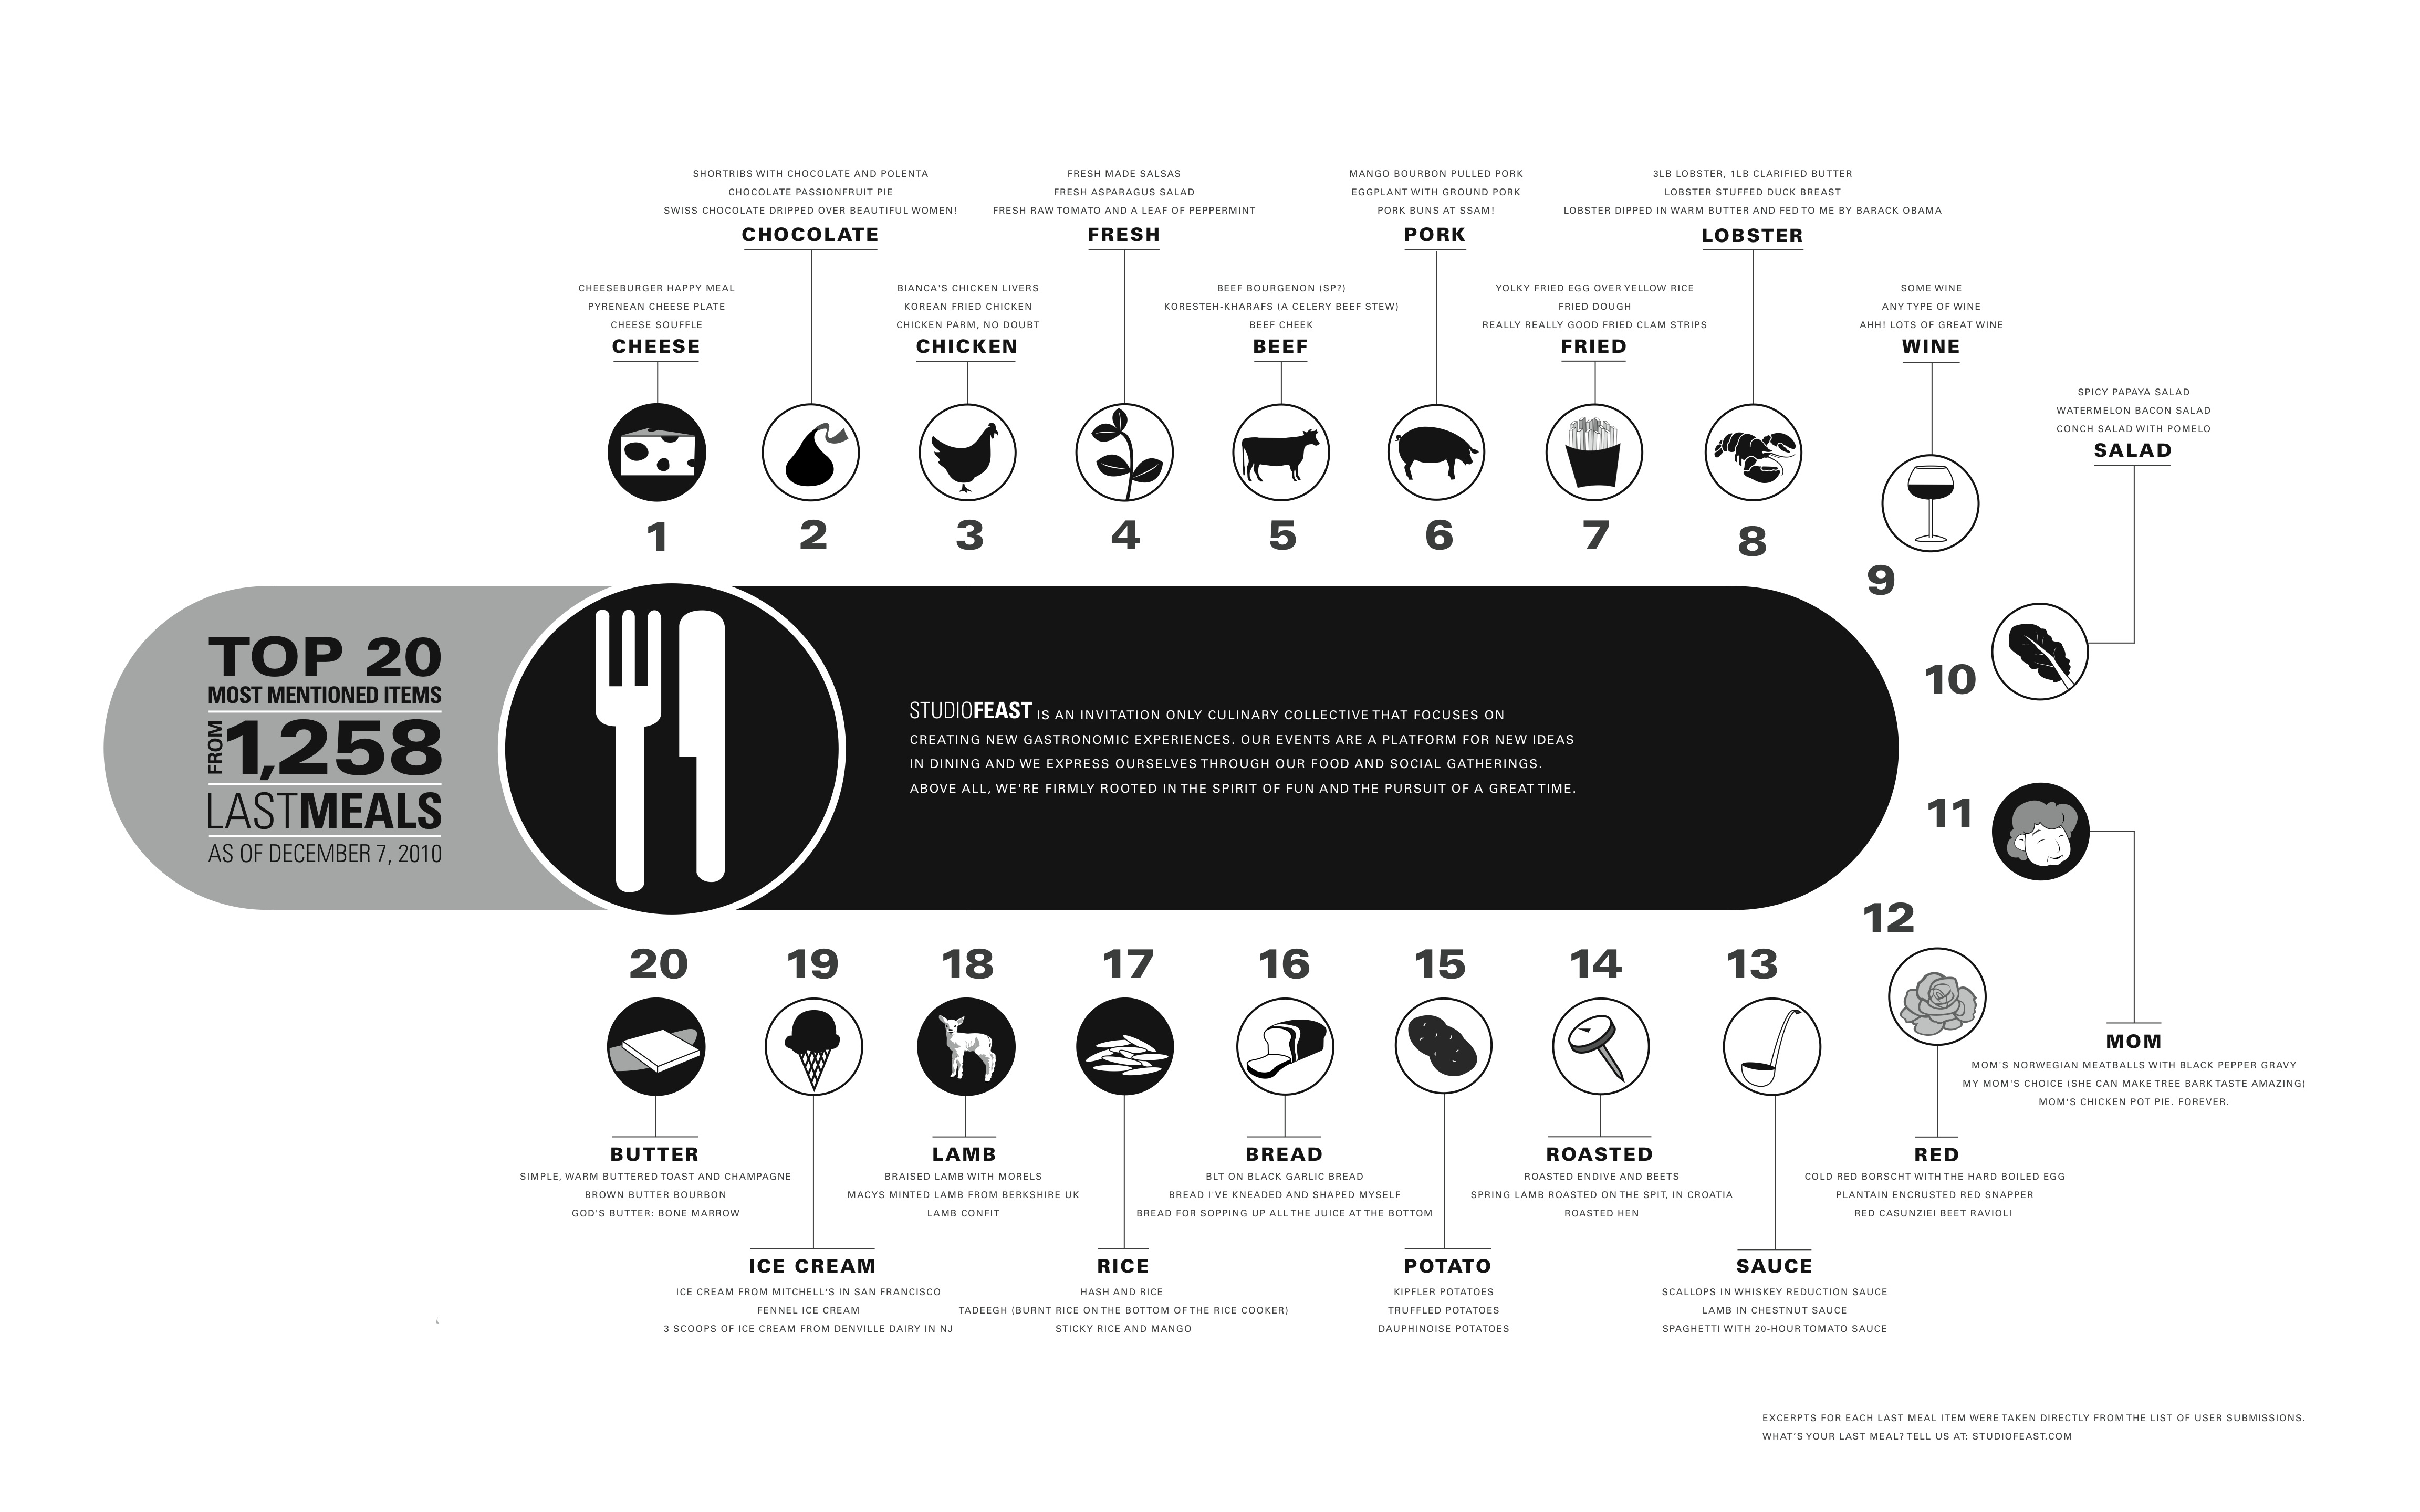
designed by Soo Baik
“You’re about to die, what’s your last meal?”
Since 2007, Studiofeast supper club founder Mike Lee has asked his mailing list subscribers to answer this question to get a better sense of who he’s cooking for. Four years and 1,200 responses later, Lee and the Studio Feast crew decided to mine that data as inspiration for their last event of 2010- The Last Meal.
By combining food, art, culture, provenance, psychology, nostalgia, data mining, and graphic design, the ever-imaginative Studiofeast takes the consumption experience to a whole new level.
Danielle Gould: What inspired you to ask the question, “You’re about to die, what’s your last meal?”
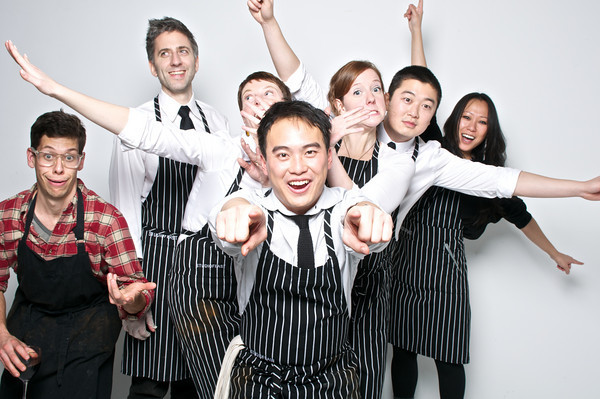
Mike Lee (center) with Studio Feast Crew / photo credit: www.pop-up-studio.com
Mike Lee: I simply wanted a good way to know who people were when they requested to be added to our mailing list. This has always been one of those questions that forces you to get real about yourself and what you like to eat if shit hit the fan, assuming you answer it sincerely. A person’s response is really telling of who they are and, often, what kind of dinner guest they would be. You can see right away what kind of person is by their response to this question: an honest one (bread and butter), a fancy one (tasting menu at Jean Georges), a hedonist (beautiful women covered in swiss chocolate), a sentimental (mom’s chicken soup), a traveler (american name, foreign food), a boozer (no food, just wine), or a total liar (obscure animal X, rare wine Y, improbable location Z). It’s always great to know who you’re cooking for and this question seemed like the best way to get to know the crowd in a lightweight way.
DG: Did you always intend to use the data in this way? If not, what inspired you to mine the data?
ML: To be honest, when I placed this question on the website I had no idea where Studiofeast would go or how large it would get. I figured we’d get a few people responding and that it would make for a fun read. Almost four years later as the list grew significantly, I was surprised to find that most people would fill this out and I had a giant dataset on my hands. When I was sending out an invite to a dinner we had earlier this year, it really hit me how much great data we had. By then, it was pretty obvious that something had to be done with it all, so here we are.
DG: What considerations went into how you organized the data?
ML: At first, I went through the list and simply checked off all the things that sounded interesting and would make for a nice dinner. Once I did that and culled the list down to a managable dozen dishes, it didnt make for a very well rounded meal. It also didn’t reflect the entire body of responses, just a few outliers who had especially novel or honest food suggestions. The idea then came to plot out the most frequently mentioned items which we would use to create a completely original meal from. That way, we could better represent the overall sentiment of our followers and be able to inject our own creativity into the menu. We ended up taking the top 20 most mentioned items and then creating an completely original menu from those items.
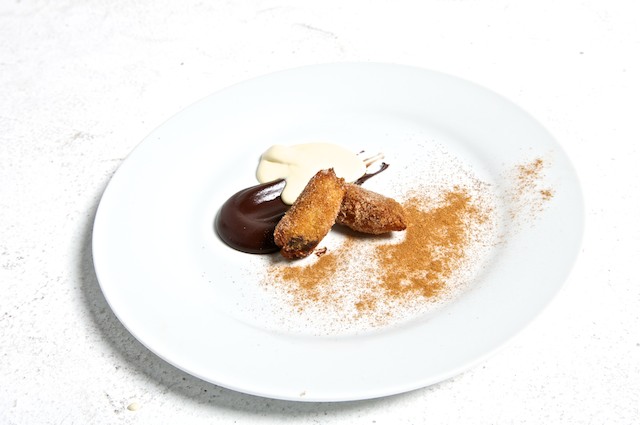
BACON CHURRO: Dark Chocolate Ganache, Horchata Ice Cream (Chocolate-Pork-Fried-Ice Cream) / photo credit: www.pop-up-studio.com
DG: What interesting and/or surprising things have you learned through this experiment?
ML: I still can’t believe that salad was the 10th most mentioned item. Don’t get me wrong, I think a perfectly made salad is a rare and wonderful thing, and I truly enjoy eating them. But I’ve never met anyone who has any sort of deep primal or emotional connection to a salad. I think our list might be starting to lean vegetarian, which is odd because we’ve historically been extremely un-vegetarian friendly.
The top 3 were cheese, chocolate, and chicken, in that order. When I saw this, cheese and chocolate didn’t suprise me because they’re very typical things that people tend to go bonkers over. Fine. But chicken was interesting because I don’t usually hear people making too much of a fuss for it (save for fried chicken, which didn’t actually come up too often). What I saw when I looked closer was that a lot of people had very close associations with chicken and home, their mother, or some traditional ethnic dish from their country of origin. People’s earliest food memories probably involve something that’s very close to home and from what this data indicates, also involves chicken. I think that’s really telling about how people grow up to decide what’s tasty and what’s not tasty. No one grew up on Momofuku Pork Buns.

CHICKEN & EGG: White, Dark, Skin, Leek, Sweet Potato (Chicken-Sauce-Potato-Mom) / photo credit: www.pop-up-studio.com

OCHAZUKE: Trout Roe, Tsukemono, Dashi, Green Tea (Rice) / photo credit: www.pop-up-studio.com
DG: Who designed the infographic?
Soo Baik, who is one of the Studiofeast crew, was 100% responsible for creating that infographic. Derrick Yuen, also one of the crew, and I both went through the dataset with Soo and gave our input, but Soo deserves all the credit for making that thing. Nice work Soo!
DG: Your menu is quite inventive, how did the social and crowd-sourced nature of the ingredient list influence it’s design?
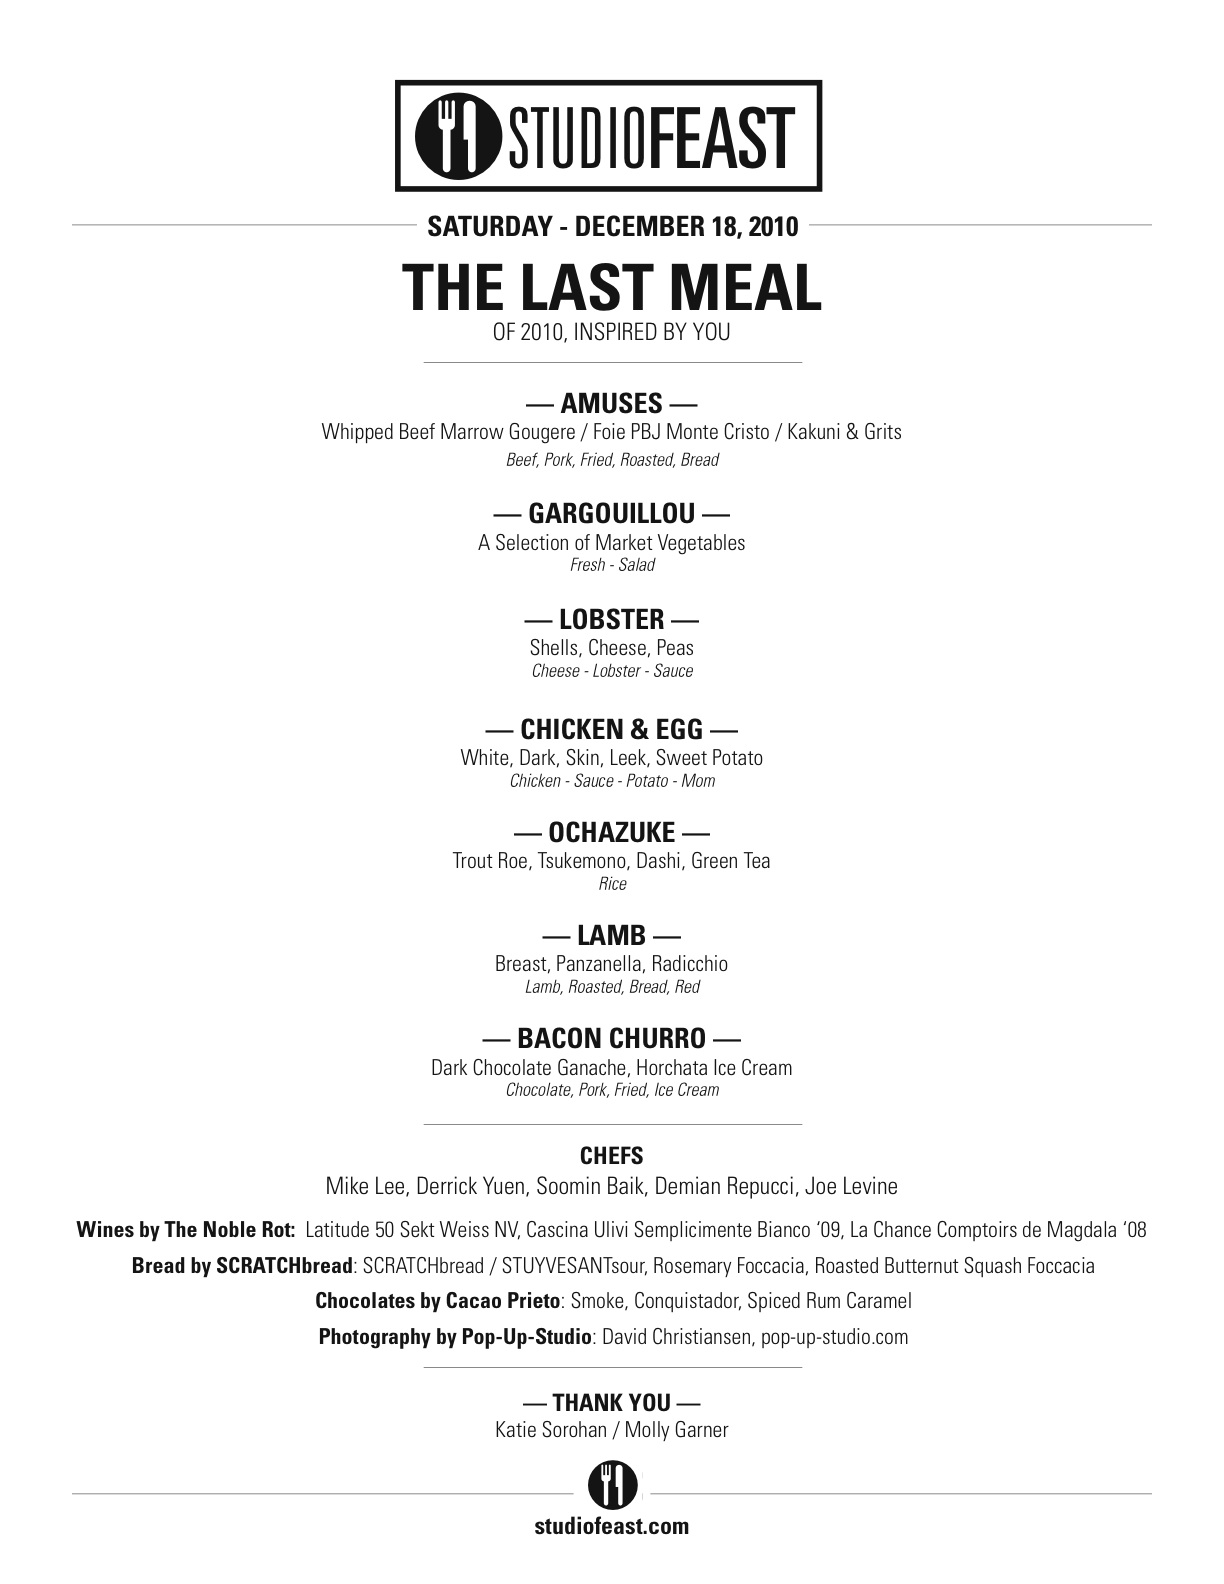 ML: First off, we wanted to make sure we used all of the food ingredients in the top 20, which we did. Some of the items in the top 20 weren’t foods, rather they were cooking techniques (roasted), characteristics (fresh), or concepts (mom). For these we had to improvise a bit and apply them to the dishes we made in straightforward (roasted lamb breast) or more creative (mom = chicken and egg) ways. For all of the dishes, we wanted to have a sense of “last meal-ness” meaning, everything was a just a little too decadent or even excessive. The Foie and PBJ Monte Cristo and the Bacon stuffed Churro were both examples of that. It was the holiday season, the close of a great year for us, and the theme really dictated it, so why not add a little extra fat and calories to the meal. You only live once.
DG: What would your last meal be?
ML: Easy: Mom’s fried rice with Dad’s sticky ribs.
—
My last meal:
Arabic salad drizzled with olive oil, sea salt, za’atar and pepper with a side of Tahini (I lived in Israel for 3.5 years & could live on this alone)
Stuffed artichoke (a favorite of mine since I was a child- my first memory of eating this was at my aunt’s annual night before Thankgiving meal at Carmine’s in NYC)
Sesame and black pepper crusted, seared bigeye tuna (I always say,’ if you are what you eat, I would be a big tuna.’ Sadly, due to overfishing and mercury I haven’t had tuna in over a year)
Steak fries with mayonnaise (indulgent and delicious, I used to want to travel around the world and write a book about the best french fries in the world)
My mother’s pecan chocolate chip pie with madagascar vanilla bean ice cream (my mother makes the absolute best chocolate chip pecan pie I’ve ever had in my life. I discovered madagascar vanilla when I started a cupcake company)


data, data mining, data visualization, food, food community, food system, food tech, foodtech, infographic, Infographics, interview, Interviews, mike lee, NYC, provenance, Recipes / Cooking, social innovation, studio feast, supper clubs