infographic
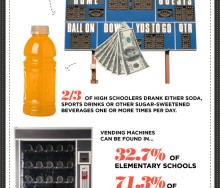
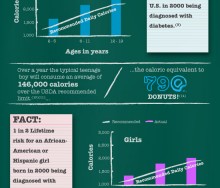
In recognition of National School Lunch Week held this week from October 10-14, 2011, the University of Southern California’s Masters of Arts in Teaching Program has develope[...]
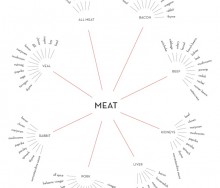
Data visualists David McCandless and Willow Tyrer explore 1000 recipes from BBC Food and Epicurious to visualize flavor patterns. The series of “infoodgraphics,” as McC[...]
If you could make a map showing the impact of food price spikes in different countries around the world, it could be a great tool to teach people about hunger and inspire them to d[...]
Last week, Environmental Working Group released Meat Eater’s Guide to Climate Change+Health, to make it easier for consumers to green their diet and the planet. They partnere[...]
Farming First, a multi-stakeholder coalition whose goal is to further sustainable agriculture development worldwide, has launched a six-part online infographic called “The St[...]
Farming First, a multi-stakeholder coalition whose goals is to further sustainable agriculture development worldwide, has launched a six-part online infographic called “The Story o[...]
Farming First, a multi-stakeholder coalition whose goals is to further sustainable agriculture development worldwide, has launched a six-part online infographic called “The S[...]
Farming First, a multi-stakeholder coalition whose goal is to further sustainable agriculture development worldwide, has launched a six-part online infographic called “The St[...]
Online business directory eLocal USA created the following infographic to visualize the true environmental, social, and economic impacts of our purchases. (Click to enlarge) Source[...]
In this five part series, Bob Wall breaks down how created the interactive mapping system for the food sovereignty, urban agriculture zoning, and food policy council maps. In part [...]
Health | Tech | Food Infographic ReelView more presentations from Luminary Labs. Last week, Luminary Labs hosted Health | Tech | Food, a Social Media Week event that brought togeth[...]
User interface and data visualization design firm FFunction created this infographic to visualize the severe decline of the honey bee population (Colongy Collapse Disorder) over th[...]
Mint.com Mint.com created this interactive infographic visualizing the consumption, production, and production value of the most commonly used burrito ingredients.[...]
What a year for food and tech! It has been truly wonderful getting to know all of you over the past couple of months. I can’t wait to connect with more of you at the events ([...]
“You’re about to die, what’s your last meal?” Since 2007, Studiofeast supper club founder Mike Lee has asked his mailing list subscribers to answer this que[...]
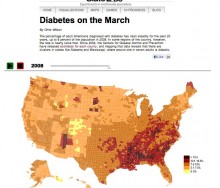
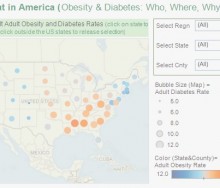
This interactive visualization by SlateLabs demonstrates the rise in diabetes diagnoses among adult Americans. Slate used data from the Centers for Disease Control and Prevention t[...]
Thank you so much to everyone who came out yesterday for the inaugural Food+Tech Hackathon! I will be covering all of the interesting people, projects, and outcomes from the event [...]
It’s been quite a week for food safety! Tuesday, the senate approved the largest overhaul of food safety legislation in 70 years. If passed, the Food Safety Modernization Act[...]
Are you still not receiving food+tech bites in your inbox? Sign up here to ensure you get deliciously interesting food+tech news, tips, and the latest apps delivered right to your [...]
Infographic about the health and fiscal cost school lunches using USDA, Let's Move & Slow Food USA data.[...]
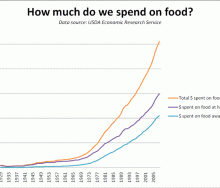
In an article last week, I discussed data that shows that a farmer receives a dwindling portion of the consumer food dollar in the US. The data does not explain the ratio of whole [...]
Yesterday, the Food Safety Modernization Act (S. 510) debate began in the Senate. The contentious S. 510 legislation will significantly expand the FDA’s regulatory authority [...]
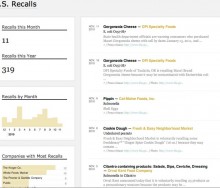
Flowing Data founder Nathan Yau has created an interactive infographic that allows you to explore FDA product recall and market withdrawals data. The graphic allows you to easily i[...]
13 Nov 2010
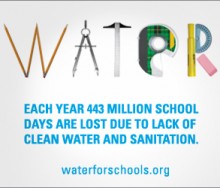
UncategorizedLast week was Blog Action Day, a day where 4,319 Blogs and 33.2 million readers from 131 different countries came together virtually to highlight and read about clean water. In all[...]
Rina Peterson's "Fit & Fat in America" enable users to examine various factors associated with obesity.[...]
18 Feb 2025
, 0 Comment
17 Dec 2024
, 0 Comment
Copyright © 2015
Food+Tech Connect. All Rights Reserved. Made in New York.

