itools
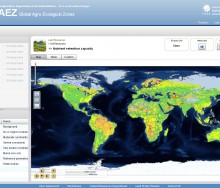
In anticipation of the impending challenge of feeding 9 billion people by 2050 , the Food and Agriculture Organization of the United Nations (FAO) and the International Institute [...]
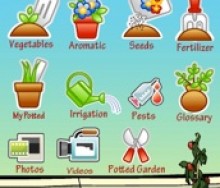
Bob Wall reviews the Potted Garden iPhone app.[...]
What would a design tool for curating meaningful ecological relationships look like? A decade ago, inspired by this question, I conceived of a web-based application for designing [...]
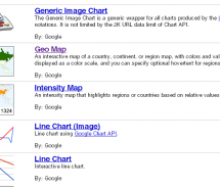
On Thursday I discussed the loading of the data from the spreadsheet into a map. While the map is free, it is obviously limited. There are not nearly as many options for displaying[...]
In yesterday’s installment, I spoke of how we decided to store our data, what freeing the data means for us and for others, and how we found a simpler data solution that worked for[...]
13 Apr 2011
UncategorizedYesterday, in part 1, I outlined how quickly the world of technology is changing. John set the bar by accessing open source code from Google and said: “Look, the map is up. Now wha[...]
In this five part series, Bob Wall breaks down how created the interactive mapping system for the food sovereignty, urban agriculture zoning, and food policy council maps. In part [...]
Have you ever wanted to scavenge for your own edibles? Maybe you passed a neighbors apple tree and saw rotting fruit on the floor or were in a neighborhood park and wondered if any[...]
Please meet our newest contributor Bob Wall. Bob recently launched iTools: Urban Ag Technology, a weekly column on Grown In The City, that focuses on the intersection of urban agri[...]
18 Feb 2025
, 0 Comment
17 Dec 2024
, 0 Comment
Copyright © 2015
Food+Tech Connect. All Rights Reserved. Made in New York.

