News + Analysis
Browse by topic
Tags
agriculture
agtech
amazon
apps
Biodiversity
Blue Apron
cpg
cultivated meat
cultured meat
data
food
food+tech
food data
Food Delivery
food entrepreneurs
food innovation
food startup
food startups
food system
food tech
foodtech
food technology
food waste
future of dining
future of food
Hack//Dining
Hack//Dining NYC
health
infographic
Internet of Food
local food
Mobile
nutrition
plant-based
plant-based meat
recipes
restaurant tech
Social Media
startup
sustainable food
technology
Tools
USDA
video
Whole Foods
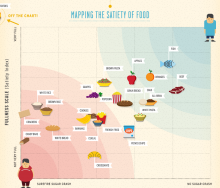
The latest infographic from Column Five and Massive Health maps the Satiety Index against the Inverted Glycemic Index to determine which foods fill you up and keep you satisfied.
[...]
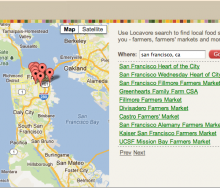
Local Dirt and Locavore recently launched a free search widget and API for their farm, farmers market and CSA mapping data. There are over 35,000 United States and Canad-based farm[...]
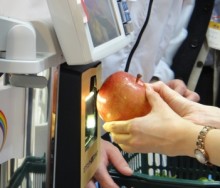
A new food recognition scanner developed by Toshiba Tec may change the way we shop, and potentially the way we maintain information about perishable food. The Object Recognition Sc[...]
There are two interesting pieces of news from last week on the ways social media is being leveraged to share information about food safety concerns, as well as to predict outbreaks[...]
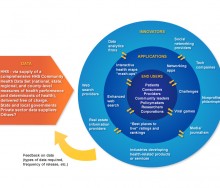
This June 5, the best and brightest of the food tech community are being invited to showcase your work at the third annual Health Data Palooza. Hosted by The Health Health Data In[...]
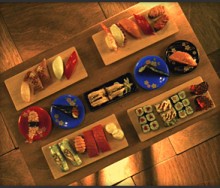
“The Story of Sushi” is an enlightening tale of sushi's journey from sea-to-plate. Created as a marketing video for Bamboo Sushi, a sustainable sushi restaurant in Portland, Oregon[...]
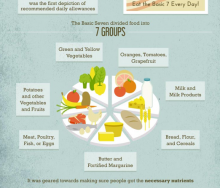
This week's infographic is an interesting visual timeline of USDA Food Guidelines, including commentary about the problems associated with each version of the guideline.[...]
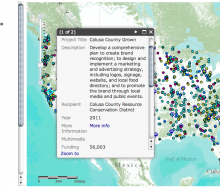
Yesterday, the USDA launched Know Your Farmer, Know Your Food (KYF) Compass, a new digital report that details USDA support for local and regional food projects. The wealth of data[...]
In this senior thesis project, German interaction design students Benedikt Burgmaier and Fabian Kreuzer re-imagine the meat, cheese and fish counter to provide customers with detai[...]
BROWSE BY TOPIC
agriculture
agtech
amazon
apps
Biodiversity
Blue Apron
cpg
cultivated meat
cultured meat
data
food
food+tech
food data
Food Delivery
food entrepreneurs
food innovation
food startup
food startups
food system
food tech
foodtech
food technology
food waste
future of dining
future of food
Hack//Dining
Hack//Dining NYC
health
infographic
Internet of Food
local food
Mobile
nutrition
plant-based
plant-based meat
recipes
restaurant tech
Social Media
startup
sustainable food
technology
Tools
USDA
video
Whole Foods
Events
09:30 am
09:30 am
09:30 am
09:30 am
09:30 am
09:30 am
09:30 am
09:30 am
09:30 am
09:30 am
09:30 am
09:30 am
09:30 am
09:30 am
09:30 am
09:30 am
09:30 am
09:30 am
09:30 am
09:30 am
09:30 am
09:30 am
09:30 am
09:30 am
09:30 am
09:30 am
09:30 am
09:30 am
09:30 am
09:30 am
09:30 am
09:30 am
09:30 am
09:30 am
09:30 am
09:30 am
09:30 am
09:30 am
09:30 am
09:30 am
09:30 am
09:30 am
09:30 am
09:30 am
09:30 am
09:30 am
09:30 am
09:30 am
09:30 am
09:30 am
09:30 am
09:30 am
09:30 am
09:30 am
09:30 am
09:30 am
09:30 am
09:30 am
09:30 am
09:30 am
09:30 am
09:30 am
09:30 am
09:30 am
09:30 am
09:30 am
09:30 am
09:30 am
09:30 am
09:30 am
09:30 am
09:30 am
09:30 am
09:30 am
Copyright © 2015
Food+Tech Connect. All Rights Reserved. Made in New York.

