California is enduring its most severe drought on record and is running out of water quickly. This has big implications for agriculture production. The state uses 80% of its water supply for agriculture and produces a whopping one third of the nation’s vegetables and almost two thirds of our fruit.
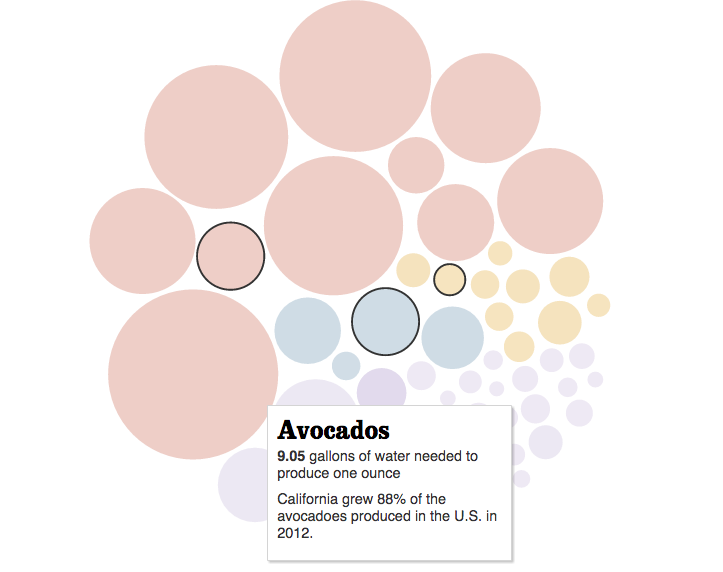
In an effort to educate eaters on the water footprint of the foods they consume, the Los Angeles Times created the interactive infographic below. Based on a report by the UNESCO Institute for Water Education entitled “The Green, Blue and Grey Water Footprint of Crops and Derived Crop Products” and data from the Water Footprint Network, the two part graphic lets you explore how much water different crops require and then helps you visualize the water footprints of sample meals through the “Random Plate” feature.
Playing around with the interactive graphic, I discovered some unexpected data. A few of my findings are below. You can take your own water footprint educational journey here.
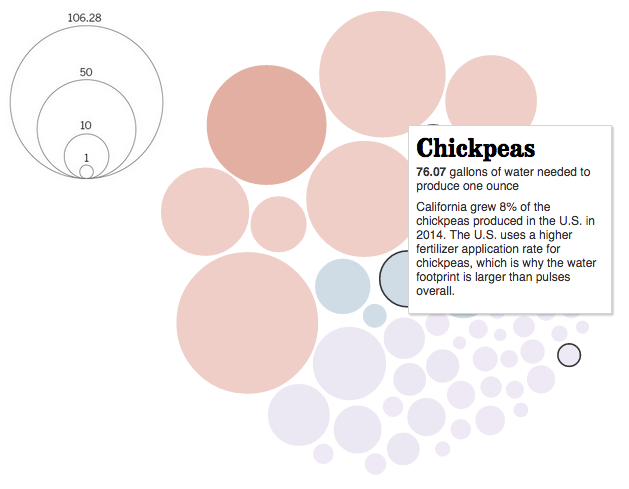 Not surprisingly, beef takes the lead as the biggest water-hogger, requiring 106.28 gallons to produce one ounce. But interestingly, due to a higher rate of fertilizer application, chickpeas and lentils have an enormous water footprint, requiring 76.07 and 71.28 gallons to produce a single ounce respectively. This is roughly 30 gallons more than pork and 55 gallons more than chicken.
The graphic also highlights California’s colossal contribution to our nation’s fruit and vegetable supply. It produces 81% of our carrots, 88% of our avocados, 91% of our grapes and tomatoes, 92% of our strawberries and a whopping 99% of our artichokes.
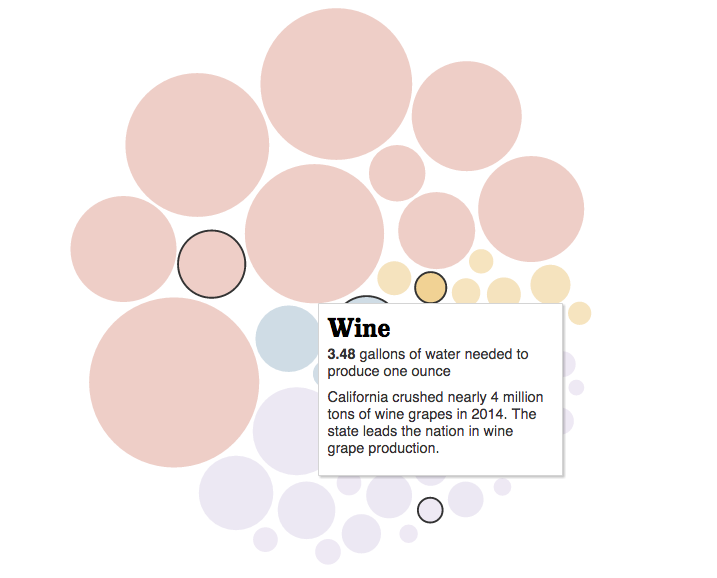 Wine and milk are huge water guzzlers, the graphic points out. At 3.48 gallons of water needed to produce an ounce, wine has one of the largest water footprints. And milk requires a shocking 5.48 gallons per ounce, which is particularly staggering since California has been that nation’s top producer of dairy since 1993. However, beer has the smallest footprint of all the featured drinks, requiring 1.96 gallons per ounce.
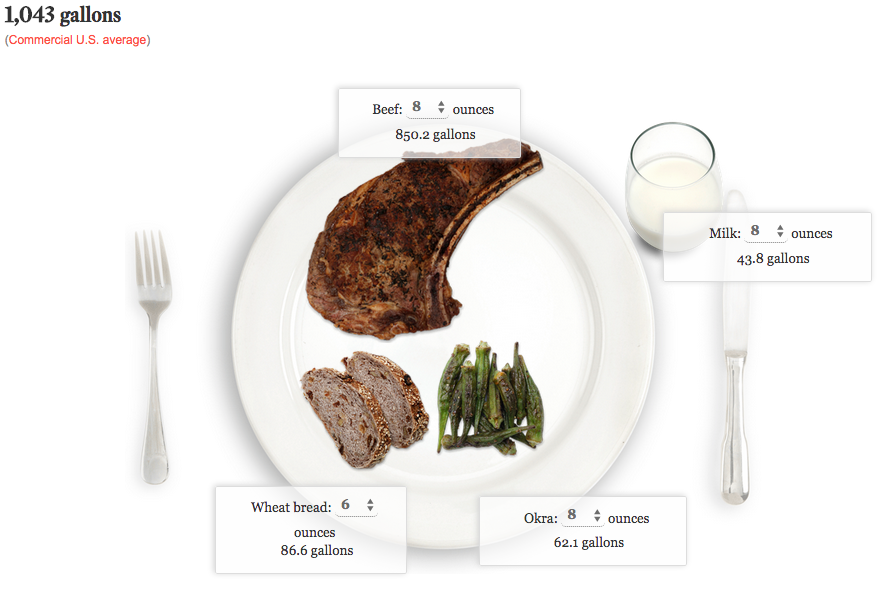 The Random Plate feature lets you mix and match sample dinner plates and calculates the water footprint for each. By substituting chicken for beef, the plate’s footprint decreases from 850.2 gallons to 132.9, and swapping out okra for eggplant saves 48.6 gallons of water, to name a few examples. Beef, pork, lamb, chickpeas, lentils, peas, goat and asparagus are serious water hogs. While cabbage, strawberries, onions, lettuce, carrots, eggplant, grapefruit and tomatoes require significantly less to produce, according to the graphic.
Hopefully this interactive visualization encourages eaters and the foodservice industry nationwide to be more conscious of the water footprints of our food, to waste less and to support local agriculture production.

![Why Your Groceries May Be More Expensive in 2013 [Infographic]](https://foodtechconnect.com/wp-content/uploads/2012/07/grocery-price-climate-desk-200x200.jpg)
