The Food, Conservation and Energy Act is one of the most daunting and boring, 684 page documents you’ll never have to read. And yet what’s in it affects every one of us in the U.S., and many abroad, every day. [See Food+Tech Connect’s What is the Farm Bill? And Why Should I Care? for more info on the Bill and What the Farm Bill is Going On? A Simple Timeline of Events to learn about what is going on with it.]
So how do we get people to care about what the Bill says and how it impacts our communities? How can the food+tech community come together to encourage people to be involved?
Thus far, there is little in the way of visually interesting and informative media about the Farm Bill. Not only is the Bill complicated (and did I mention, boring?), but many news and advocacy groups do not have the technical ability to create something accurate and engaging. Which is one reason why Food+Tech Connect is holding a Farm Bill Hackathon this December 3rd.
In the mean time, over the course of the next month, Food+Tech Connect will compile an inexhaustible list of interactive, intriguing, and useful media that groups are creating to entice the American public to care about the Farm Bill. And we want to hear from you. Send in your web apps, videos, infographics and the like to beth[at]foodtechconnect.com and we will add your picks to our list.
But now, here are Food+Tech Connect’s picks for the first 6 Farm Bill Media Sensations of 2011:
Pick #1
Ken Cook, Environmental Working Group (EWG) – Turning the Farm Bill into the Food Bill at TedxManhattan: Changing the Way We Eat
In perhaps the most easily digestible Farm Bill talk ever, Ken Cook of the EWG lays out what the bill is and what is wrong with it using interesting graphics (maps, charts). He also invites action on the bill, and tells you how to do it. He even makes people laugh.
Pick#2
Viable Agricultural Solutions – designed by Will Tietje, undergraduate at Louisiana State University
 In this series of 14 in-depth visualizations, Tietje uses a 460-acre rice, crawfish, and soybean farm in Southwest Louisiana as a way to look at everything on a farm from equipment costs to subsidy payments. In this model (which is admittedly quite complicated), a farmer farming 1000 acres, receives $70,000 in subsidy payments, but makes a profit of only $35,000 a year. Unfortunately, each page of the project has to be opened separately in order to view the information, but perhaps the infographics will find a better home soon.
Pick #3
Farm Bill Budget Visualizer – John Hopkins Center for a Livable Future
This just-out Farm Bill Budget Visualizer promises hours of good clean fun for the whole family. An elaborate “treemap,” the visual allows viewers to see a particular aspect of the Farm Bill budget in relation to all other parts. Here we can see the granularity of budget allotments such as “research” which lists Organic Agriculture Research and Extension Initiative ($20 million in 2011) as just slightly better funded than Biotechnology Regulatory Services ($13 million in 2011). A truly impressive work.
Pick#4
Understanding the Farm Bill – Institute for Agriculture and Trade Policy (IATP) and Matthew Foster
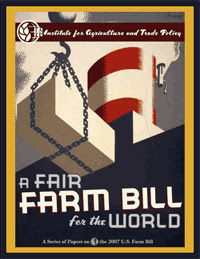
On a completely different note, IATP goes old school with a collection of updated WPA posters for the Farm Bill. Each of the 8 posters, however, is connected to a paper outlining a particular angle on the Bill, such as A Fair Farm Bill for Renewable Energy, or A Fair Farm Bill for the World’s Hungry. While certainly not light reading, the papers are visually interesting, and focus on one particular piece of the puzzle, perhaps making it more easily understood and relevant to readers.
Pick #5
Commodity Cropism from Stefani Bardin on Vimeo.
We have profiled Stefani Bardin’s Commodity Cropism before, but we can’t forget about it when talking about the Farm Bill. It is an elegant look at the prevalence of three big commodity crops in our lives – soy, sugar and corn.
Pick #6
Parents Stand Up For Food – Parent Earth
And last, but certainly not least, Parents Stand Up For Food brings us a completely over-the-top video in which we learn some of the most horrifying stats connected to the Bill, like the fact that 1 out of 3 kids will be obese or diabetic by high school. But their website also includes links to deepen ones understanding of what is in the bill, including videos with community leaders and physicians.


