It was exciting to see such an overwhelming response to the food system visualization we posted last week. The map served to start defining the food+tech space and identifying the realms that touch food, from politics and environment, to demographics and economics. As many of you pointed out, the map was a welcome representation of complicated relationships. It also did not offer much depth to the stories it told.
The visualization is certainly a unique depiction of the inter-related concepts and challenges that connect our food system. It conveys the complexity, but perhaps does not draw out the nuances. However, the nuances, exceptions, and unobserved dynamics are what make our food challenges so great. In the spirit of finding the leverage points in this system that, if addressed, could have a profound impact on the whole, we identified three examples of relationships in that map that we thought were worth digging into. There are many more, but these three serve as examples of what systems mapping can illuminate and how data can be applied to resolve the core policy, behavioral, investment, and innovation challenges that need to be overcome in order to cultivate an optimized food system.
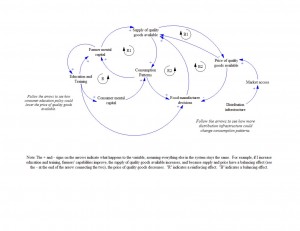
1. Consumers and education – The map does not show an arrow between “Consumers” and “Education and Training”. Instead, the education component drives toward “Science” and “Mental Capital” of the farmers. Structuring the map in this way assumes that education and expertise push into food production and supply chains and that their benefits reside exclusively on the farm. However, consumer-facing education, whether about the selection, preparation, or consumption of food, can actually pull products and philosophies through those relationships, influencing with consumer demand what and how retailers and wholesalers source agricultural products. If we were to show an arrow connecting “Education and Training” to “Consumption Patterns” and understand the dynamics that connected the two, we might be able to develop better public health campaigns, school food programs, and consumer messaging to shift demand, which would in turn affect the flow of food through the value chain.
2. Supply chain and education – While farmer education is a critical component to more efficient, more environmentally sound agricultural production, “Education and Training” needs to extend to every participant in the value chain, especially buyers and procurement officers in companies. Each value chain participant is responsible for a different aspect of sustainability, ethical behavior, and environmental and social accountability. Big agricultural companies are jumping on the sustainability wagon, but their efforts to bring environmental, social, and economic needs into harmony will be futile unless the training and time to shift mental models about sourcing and processing agricultural ingredients keeps pace with the needs, trends, and practices of all the other value chain participants.
3. Connected pricing – There are lots of places in the world where supply and demand do not single-handedly define pricing, as this map suggests they might. In most developing markets, informal middlemen get paid to add little value to the harvest coming through the town square, but their roles survive because farmers have access to so few market alternatives. Even if farmers had better market opportunities, limited distribution options limit these farmers’ ability to access more sophisticated value chains. If we tied distribution infrastructure into pricing, we might identify ways in which a policy that addresses distribution and market access could influence consumption patterns.
The point of all this is to say, take a good look at the map. It’s a thoughtful approach to the relationships in the food industry, but it would need another dimension or digital content to tell a more detailed story, and we need that story to take action.
– Elizabeth McVay Greene


