In anticipation of the impending challenge of feeding 9 billion people by 2050 , the Food and Agriculture Organization of the United Nations (FAO) and the International Institute for Applied Systems Analysis (IIASA) recently developed the Global Agro-ecological Zones (GAEZ) Portal. This new online data platform allows users to identify the geographical areas with the greatest potential to significantly increase yields in food production without depleting natural resources.
Within the next several decades, food production must increase to more than double its current output levels to meet the needs of future generations. But in order to reach this goal, increased agricultural production must take place for the most part on land that is already being farmed and cultivated. And the planet’s shrinking natural resource base and increasing vulnerability to climate change only compound the issue of the future of food.
The GAEZ portal will play an important role in addressing these issues–a point emphasized by Alexander Mueller, Assistant Director General of the FAO’s Natural Resources Management and Environment Department:
”The new GAEZ data portal will provide a global tool to manage natural resources for food and agriculture in a more sustainable way. Natural resources are the basis for food production. In a world already facing today water scarcity and land degradation in many areas and coping with increasing risks from climate change, this is the only way to achieve food security,” he said.
Serving as a repository for the FAO’s extensive collection of agro-ecological data, the GAEZ houses information gathered during the most recent global assessment of agro-resources, a process the organization undertakes every few years to collect current data on land productivity. The data is grouped into five broad themes: Land Resources, Agro-climatic Resources, Suitability and Potential Yield, Actual Yield and Production, and Yield and Production Gaps—and then divided further into sub-categories with corresponding datasets.
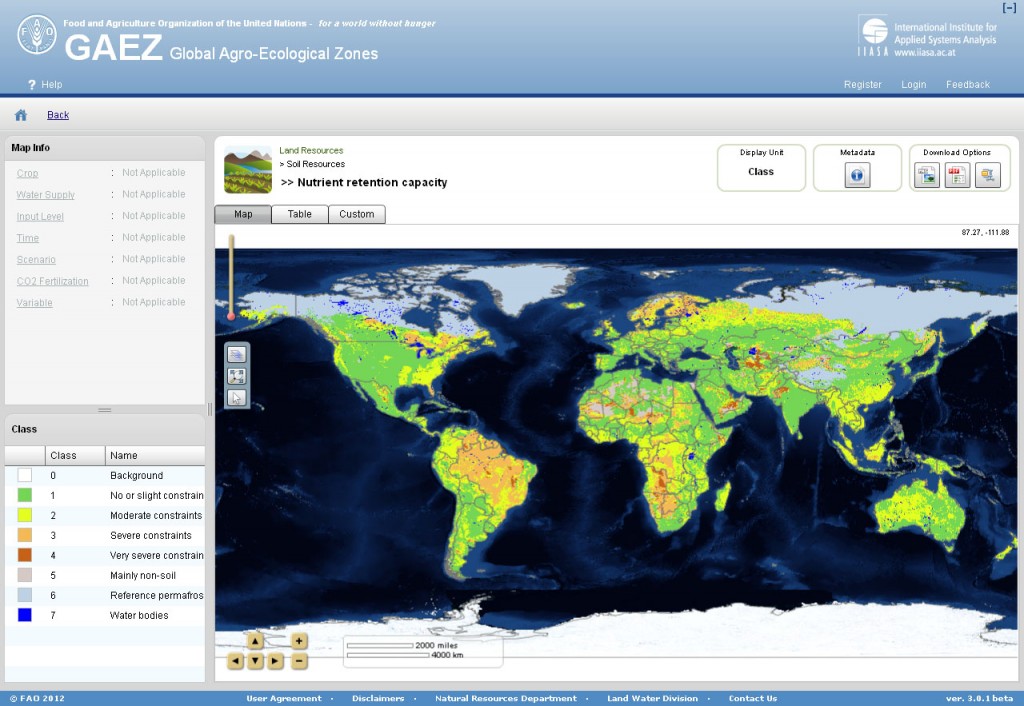
The online portal allows users to select several sub-categories and visualize the data on a world map. For instance, the following map is a visualization of the Nutrient Retention Capacity dataset selected from the Land Resources theme and the Soil Resources sub-category. The visualization clearly suggests potential for better nutrient retention (and possibly increased production) in vast expanses of land across Asia, Europe and North America.
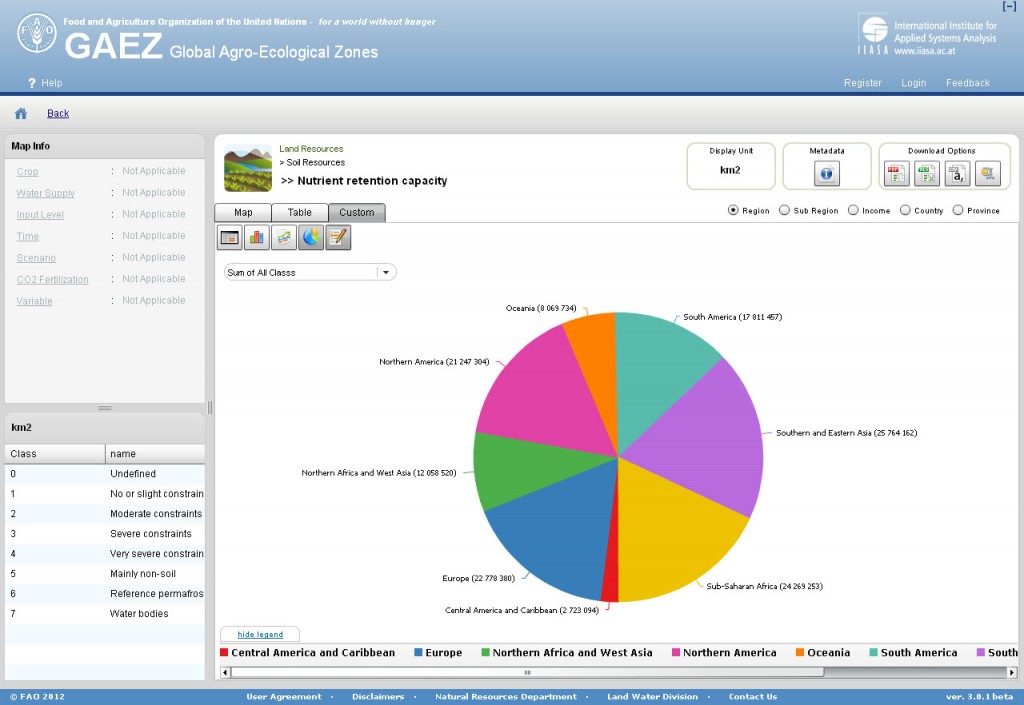
Further viewing options include a spreadsheet of the data, or choices between other visualizations such as a bar graphs and pie charts. The pie chart below reveals the nutrient retention capacity available in sub-Saharan Africa that was not as evident in the map visualization.
The portal also gives access to metadata (with additional info about the dataset), and it allows users to download image, PDF, and excel files of the data.
The data itself provides valuable information about land production across the globe, but the new data portal allow a variety of users to access data in a way that is easier to comprehend and utilize for further research and assessments. Because the information is catalogued based on geographic agro-ecological zones, users can pinpoint production discrepancies between different zones with similar environments and production systems, allowing them to identify underlying causes of decreased outputs (e.g., inadequate policies or support services). With this information at hand, land use planners, agricultural specialists, policymakers and farmers alike can determine exactly where and how to improve sustainable intensification of agricultural production to best meet our future food needs, while preserving precious natural resources.


![Farming First: How can we manage environmental sustainability with economic viability? [Infographics]](https://foodtechconnect.com/wp-content/plugins/wordpress-23-related-posts-plugin/static/thumbs/2.jpg)

